Landing page analytics measure how visitors interact with a landing page and how effectively it converts traffic into leads or customers. When I analyze landing page performance, the first thing I look at is whether the page is turning incoming traffic into meaningful actions such as form submissions, sign-ups, or purchases.
Driving traffic to a landing page is only the first step. What matters more is how visitors behave once they arrive, whether they click a call-to-action, complete a form, scroll through the page, or leave without engaging.
Data supports this challenge. According to HubSpot, the average landing page conversion rate across industries is about 5.89%, which means the majority of visitors leave without converting.
In this article, I’ll break down the most important landing page site analytics you should track, explain why each metric matters, and show how these insights help identify conversion problems and improve landing page performance.
What Is Landing Page Analytics?
Landing page analytics refers to the process of tracking and analyzing how visitors interact with a landing page and how effectively the page converts traffic into desired actions such as form submissions, sign-ups, or purchases.
When I evaluate landing page performance, I focus on metrics that reveal both user behavior and conversion outcomes. These typically include conversion rate, bounce rate, traffic sources, time on page, and click-through rates.
By analyzing these metrics, businesses can understand whether a landing page is engaging visitors, where users drop off in the conversion process, and which elements of the page influence user actions.
In simple terms, landing page analytics helps identify what is working on a landing page, what is not, and what improvements can increase conversions.
Why Tracking Landing Page Analytics Matters?
A landing page is designed to achieve a specific goal, such as generating leads, collecting sign-ups, or driving purchases. Without tracking analytics, it is difficult to know whether the page is actually achieving that goal.
When I analyze landing pages, I rely on analytics to understand how visitors interact with the page and where the conversion process breaks down. Metrics such as conversion rate, bounce rate, and click-through rate reveal whether users are engaging with the content or leaving without taking action.
Landing page analytics also help identify friction points. For example, a high bounce rate may indicate that the page does not match user expectations, while a low form completion rate can signal that the form is too long or confusing.
By tracking the right metrics, I can move beyond assumptions and make data-driven decisions. Instead of guessing what might improve conversions, analytics show exactly where optimization efforts should be focused.
How Landing Page Analytics Help Optimize Conversions
Identify where visitors drop off
By analyzing metrics such as bounce rate and exit rate, I can identify where visitors leave the page without taking action. This helps pinpoint sections of the page that may be confusing, irrelevant, or failing to capture attention.
Understand how users interact with the page
Analytics reveal how visitors scroll, click, and navigate through a landing page. This behavior data helps determine whether important elements such as headlines, forms, or CTAs are positioned effectively.
Evaluate the effectiveness of calls-to-action (CTAs)
Tracking click-through rates and form submissions helps measure how well CTAs encourage visitors to take action. If engagement is low, it may indicate that the messaging, placement, or design needs improvement.
Measure the quality of traffic sources
Landing page site analytics show where visitors are coming from, such as organic search, paid ads, or social media. This helps determine which traffic channels are driving visitors who are more likely to convert.
Detect friction in the conversion process
Metrics like form abandonment rate and session recordings can reveal where users struggle during the conversion process. Identifying these friction points allows improvements that make the experience smoother for visitors.
Support data-driven optimization decisions
Instead of relying on assumptions, analytics provide clear data about what works and what does not. This allows marketers to test changes, improve page elements, and continuously optimize conversion performance.
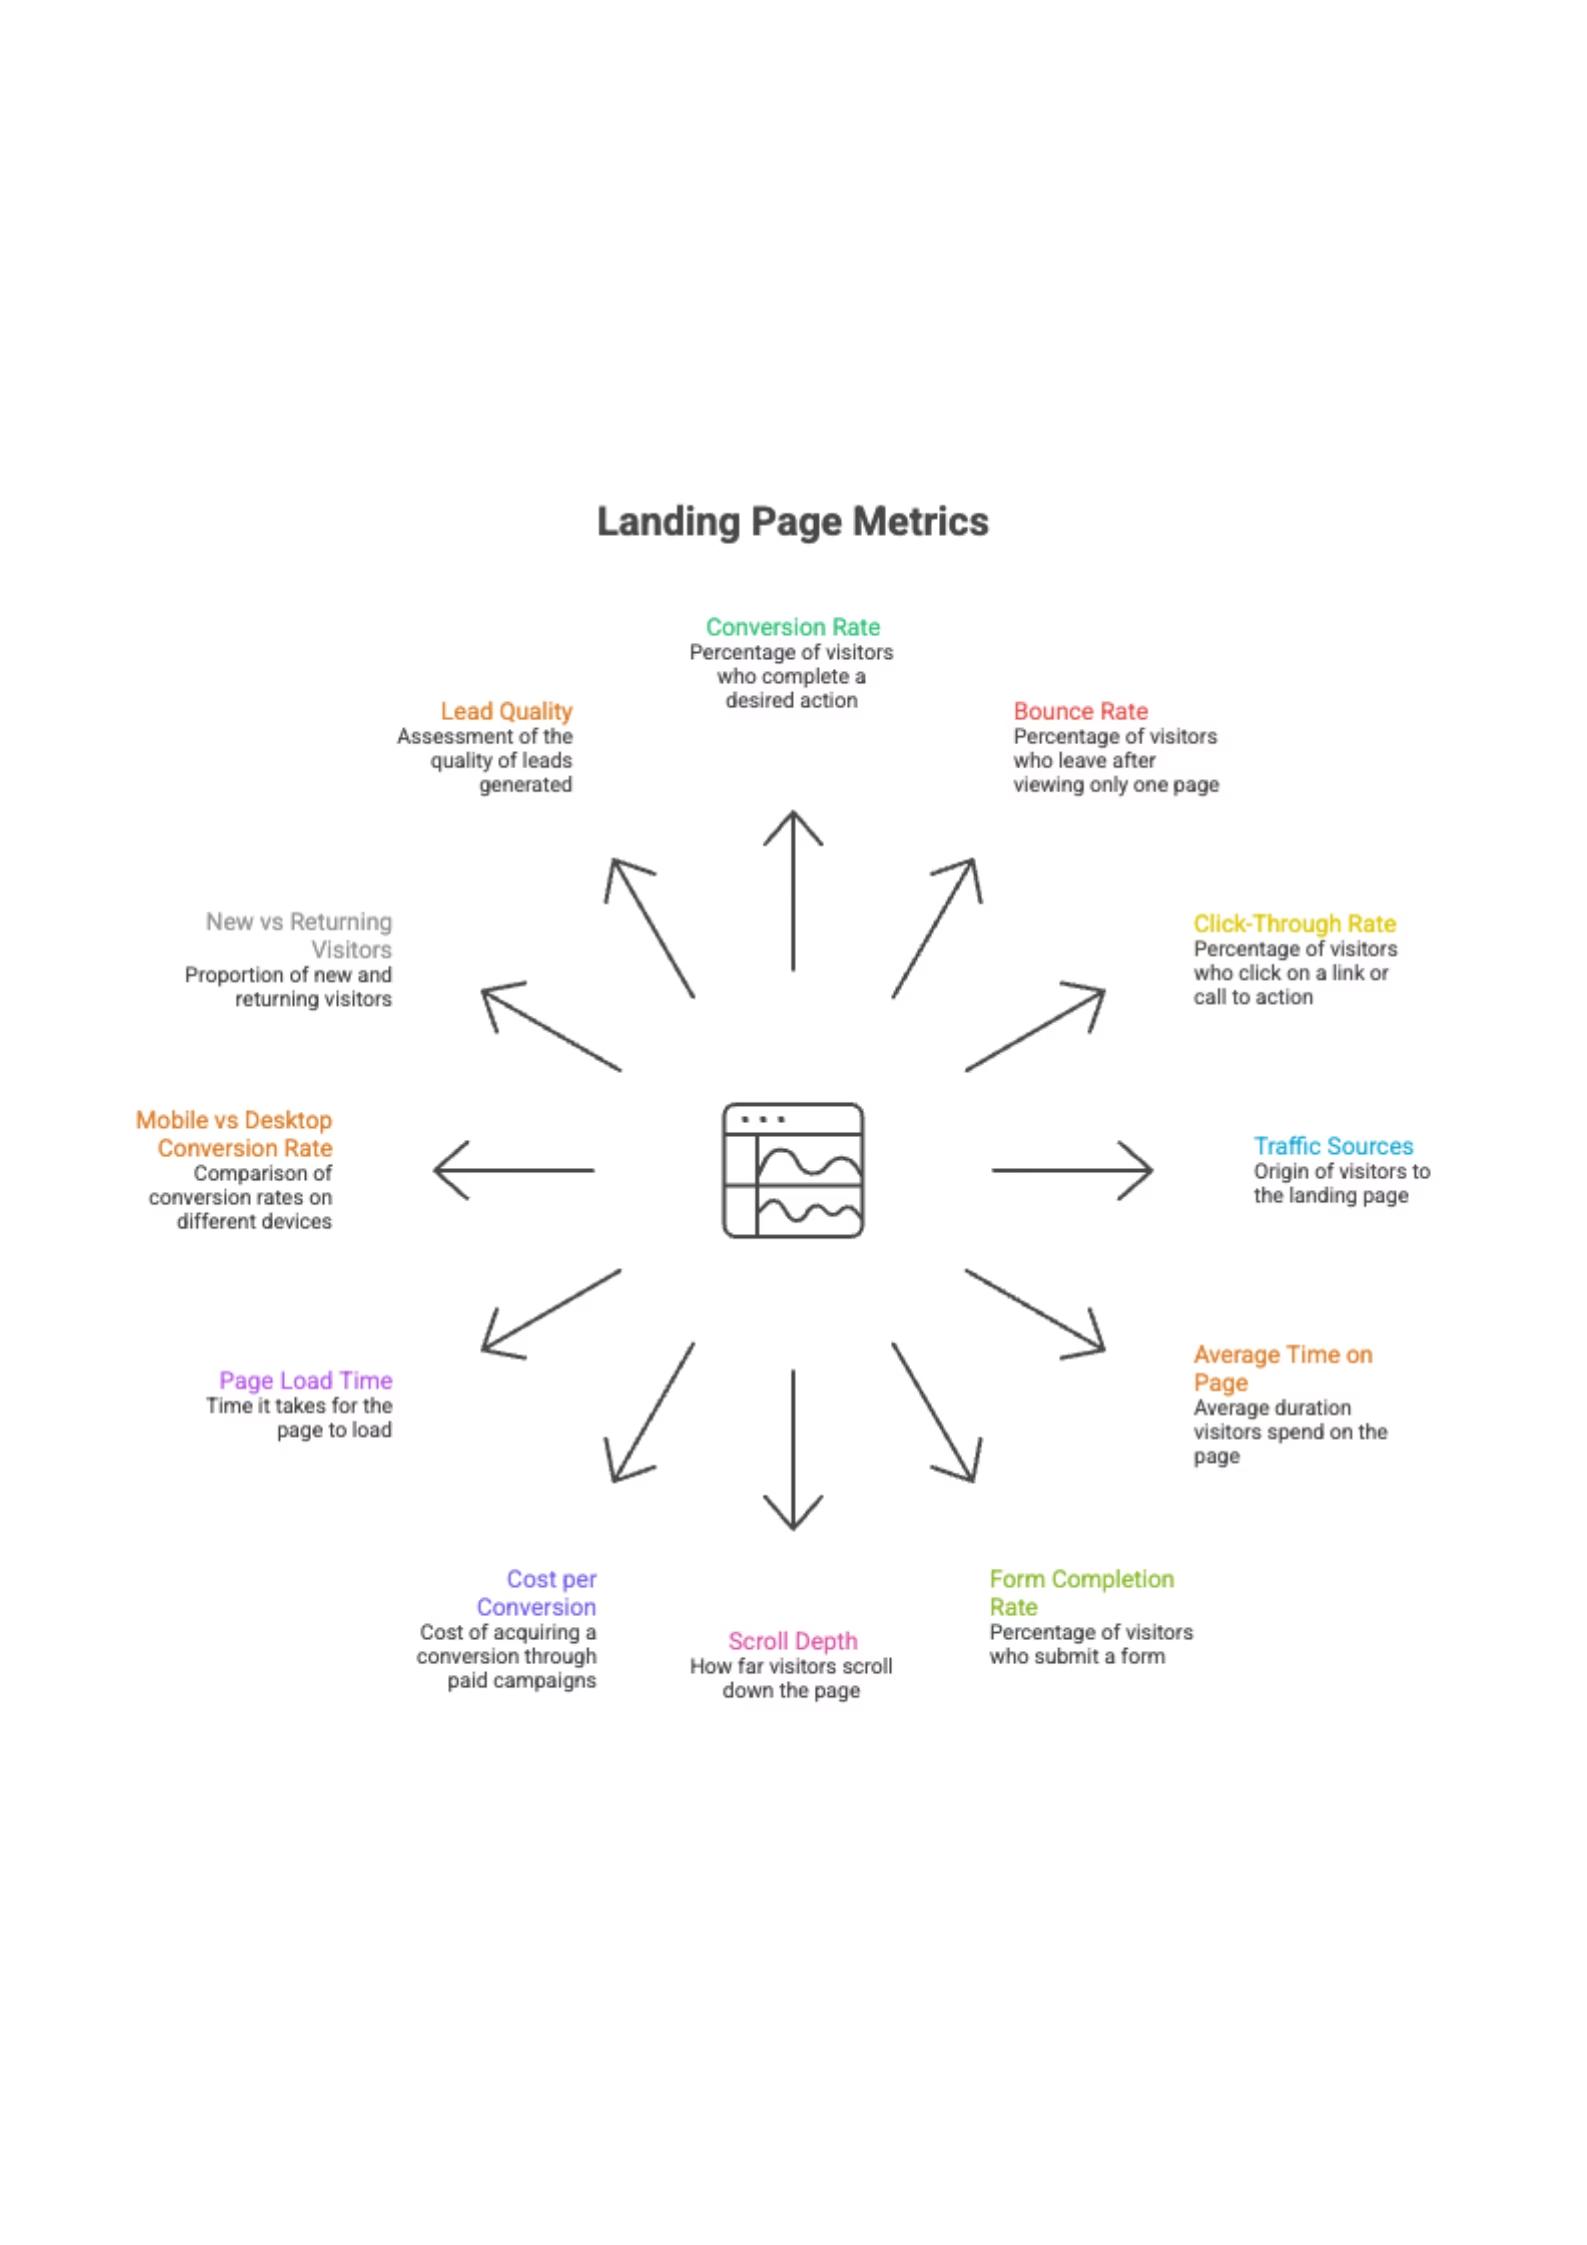
Essential Landing Page Metrics You Should Track
When I evaluate landing page performance, I focus on metrics that clearly show whether visitors engage with the page and complete the intended action. The following metrics provide the most reliable insights into how well a landing page attracts, engages, and converts visitors.
1. Conversion Rate
What it measures
Conversion rate represents the percentage of visitors who complete the primary goal of the landing page, such as filling out a form, signing up for a service, or making a purchase.
Why it matters
This is the most important landing page metric because it directly reflects whether the page is achieving its objective. A low conversion rate may indicate problems with the value proposition, page design, messaging, or the overall user experience.
2. Bounce Rate
What it measures
Bounce rate shows the percentage of visitors who leave the landing page without interacting with it or navigating further within the website. A good bounce rate typically falls between 26% and 40%, while 41%–55% is considered average depending on the website type and traffic source.
Why it matters
A high bounce rate often suggests that the page does not match visitor expectations or fails to communicate its value quickly. Monitoring bounce rate helps identify whether the headline, content, or page load speed is discouraging users from staying on the page.
3. Click-Through Rate (CTR)
What it measures
Click-through rate tracks the percentage of visitors who click on a call-to-action button or key link on the landing page.
Why it matters
CTR helps determine whether your call-to-action is compelling enough to encourage user interaction. If visitors view the page but do not click the CTA, it may indicate issues with CTA messaging, placement, or visual prominence.
4. Traffic Sources
What it measures
Traffic sources identify where visitors are coming from, such as organic search, paid advertisements, email campaigns, social media, or referral websites.
Why it matters
Understanding traffic sources helps determine which marketing channels bring the most valuable visitors. This insight allows marketers to focus their efforts and budgets on channels that generate higher-quality traffic and better conversion potential.
5. Average Time on Page
What it measures
Average time on page reflects how engaging and relevant the landing page content is. When users spend more time reading, it usually signals strong message clarity, content value, and higher chances of conversion. A healthy benchmark is 40 seconds to 2 minutes depending on page depth.
Why it matters
This metric provides insight into visitor engagement. If users spend very little time on the page, it may suggest that the content does not meet their expectations or that the value proposition is unclear.
6. Form Completion Rate
What it measures
Form completion rate shows the percentage of users who successfully submit the form after starting to fill it. A higher completion rate indicates that the form is simple, trustworthy, and easy to complete without friction.
For most landing pages, a 20%–40% completion rate is considered healthy depending on the form length and offer value.
Why it matters
Forms are often the final step in the conversion process. If many visitors start filling out the form but fail to submit it, the form may be too long, confusing, or requesting unnecessary information. Monitoring this metric helps identify friction points that reduce conversions.
7. Scroll Depth
What it measures
Scroll depth shows how far visitors move down the landing page. It helps identify whether users are actually consuming the content or leaving before reaching key sections like value propositions, testimonials, or CTAs.
Why it matters
This metric shows whether users actually see important sections such as benefits, testimonials, or the call-to-action. If most visitors stop scrolling early, critical information may be placed too far down the page.
8. Cost per Conversion (For Paid Campaigns)
What it measures
Cost per conversion shows how much you spend to acquire one lead or customer. It helps evaluate campaign efficiency and whether your landing page and ads are generating conversions at a profitable cost.
Why it matters
A landing page may generate conversions, but if the cost to acquire those conversions is too high, the campaign may not be profitable. Tracking this metric helps evaluate marketing efficiency.
9. Page Load Time
What it measures
Page load time measures how quickly the landing page fully loads after a user clicks an ad or link. Faster load speeds improve user experience, reduce bounce rates, and increase the chances of visitors staying and converting.
Why it matters
Slow pages significantly reduce conversions. Even a delay of a few seconds can cause visitors to abandon the page before interacting with it. Monitoring load time helps ensure the landing page delivers a smooth and responsive experience.
10. Mobile vs Desktop Conversion Rate
What it measures
This metric compares conversion performance across different devices such as mobile phones, tablets, and desktop computers, helping identify where users convert best and where optimization may be needed.
Why it matters
User behavior often differs by device. If mobile conversion rates are significantly lower than desktop, it may indicate issues with mobile layout, page speed, or form usability.
11. New vs Returning Visitors
What it measures
This metric identifies whether visitors are new or returning to the landing page. It helps understand audience behavior, showing whether the page attracts fresh traffic or re-engages users already familiar with the brand.
Why it matters
Returning visitors often have higher intent and may convert at a higher rate. Understanding this behavior helps evaluate whether your landing page effectively nurtures interest over multiple visits.
12. Lead Quality / Qualified Leads
What it measures
Lead quality assesses whether the leads generated from the landing page match your target customer profile and have a higher likelihood of converting into actual customers.
Why it matters
A landing page may produce many conversions, but if those leads are not qualified, the page may not contribute meaningful business value. Tracking lead quality ensures the landing page attracts the right audience.
How to Use Landing Page Analytics to Improve Conversions
Identify where visitors drop off
Analyze metrics such as bounce rate, scroll depth, and time on page to understand where users lose interest. If visitors leave early, it may indicate that the headline, page load speed, or value proposition is not capturing attention quickly enough.
Improve call-to-action performance
Review click-through rates to see whether visitors are interacting with your CTA. If the CTR is low, testing different CTA placements, button designs, or messaging can significantly increase engagement and conversions.
Optimize landing page content and structure
Engagement metrics such as scroll depth and time on page reveal whether visitors are consuming the content. If important sections are not being seen, adjusting page layout or repositioning key information can improve visibility and impact.
Simplify and optimize forms
Form completion rate helps identify friction in the conversion process. If many visitors start filling out the form but do not submit it, reducing the number of fields or improving form clarity can increase successful submissions.
Focus on high-performing traffic sources
Traffic source analytics reveal which marketing channels bring visitors who are more likely to convert. Prioritizing these channels helps allocate marketing budgets more effectively and improve overall campaign performance.
Use data to guide testing and optimization
Landing page analytics provide the foundation for data-driven experiments. Testing different headlines, layouts, or offers allows marketers to continuously improve conversion performance based on measurable results.
Common Mistakes When Analyzing Landing Page Data
Analyzing landing page analytics can provide valuable insights, but misinterpreting the data can lead to poor optimization decisions. When reviewing landing page performance, I focus on understanding the context behind the numbers rather than relying on a single metric in isolation. The following are common mistakes that can lead to incorrect conclusions.
1. Focusing Only on Traffic Instead of Conversions
Many marketers prioritize increasing traffic without evaluating whether that traffic converts. High visitor numbers may look promising, but if users are not completing the intended action, the landing page is not delivering meaningful results.
2. Misinterpreting Bounce Rate
Bounce rate is often misunderstood as a negative signal in every case. In reality, a visitor may land on a page, read the content, and leave without navigating further. Instead of relying solely on bounce rate, it is important to analyze it alongside metrics such as time on page and conversion rate.
3. Ignoring Traffic Quality
Not all traffic sources bring the same level of intent. A landing page may receive large amounts of traffic from social media or display ads, but those visitors may not be interested in the offer. Evaluating conversion rates by traffic source helps identify which channels bring the most valuable visitors.
4. Overlooking Mobile Performance
Many users access landing pages from mobile devices. If mobile conversion rates are significantly lower than desktop, the page layout, load speed, or form usability may need improvement to support mobile users.
5. Making Decisions Without Enough Data
Optimization decisions based on small data samples can lead to incorrect conclusions. Before making changes to headlines, forms, or page design, it is important to gather enough data to ensure that the observed patterns are reliable.
Conclusion
Landing page analytics help businesses understand how visitors interact with a page and whether it successfully converts traffic into leads or customers. By tracking key metrics such as conversion rate, bounce rate, traffic sources, and form completion rate, it becomes easier to identify performance issues and improve user experience.
Monitoring these landing page site analytics allows marketers to make data-driven decisions, optimize page elements, and continuously improve conversion performance over time.
Frequently Asked Question
1. What are landing page analytics?
Landing page analytics refers to the process of tracking and analyzing how visitors interact with a landing page. These analytics measure user behavior and performance metrics such as conversion rate, bounce rate, click-through rate, and traffic sources to understand how effectively the page converts visitors into leads or customers.
2. Why are landing page site analytics important?
Landing page analytics help businesses understand whether their landing pages are achieving their intended goals. By analyzing visitor behavior and conversion metrics, marketers can identify performance issues and make data-driven improvements to increase conversions.
3. What are the most important landing page metrics to track?
Some of the most important landing page metrics include conversion rate, bounce rate, click-through rate (CTR), traffic sources, average time on page, form completion rate, scroll depth, and cost per conversion. These metrics help evaluate both visitor engagement and overall landing page performance.
4. What is a good landing page conversion rate?
A good landing page conversion rate varies by industry, but studies show that the average conversion rate across industries is around 5–6%, while high-performing landing pages often reach 10% or higher.
5. How can landing page site analytics improve conversions?
Landing page analytics reveal how visitors interact with the page, where they drop off, and which elements influence conversions. By analyzing this data, marketers can optimize headlines, calls-to-action, page layout, and forms to improve overall conversion performance.
6. Which tools can be used to track landing page analytics?
Common tools used to track landing page analytics include Google Analytics, Google Search Console, Hotjar, Microsoft Clarity, and landing page platforms such as HubSpot or Unbounce. These tools provide insights into visitor behavior, traffic sources, and conversion metrics.